1
 →

A GPU task manager for Windows, Linux, and WSL: per-process VRAM, GPU activity, and LLM model/KV-cache insights (Windows AMD and NVIDIA).
shanselman/gputaskman is an open-source project on GitHub, mainly written in Python. A GPU task manager for Windows, Linux, and WSL: per-process VRAM, GPU activity, and LLM model/KV-cache insights (Windows AMD and NVIDIA). It currently holds 245 stars and 13 forks with 0 open issues, and was last pushed on an unknown date (repository created unknown).
AI Homed tracks it on the Today's Trending board, currently at rank #89 with 0 new stars today.
An htop for what's inside your GPU, not just how full it is.
Windows + NVIDIA/AMD, with Linux and WSL support (NVIDIA everywhere, AMD on native Linux; see Linux and WSL) and macOS on Apple Silicon (see macOS). A terminal UI that connects per-process GPU memory and engine activity with loaded runtimes, model files, and LLM buffer breakdowns.
Task Manager says "15 GB used." This tries to answer: *by what? Model weights? KV cache? Your browser? The desktop compositor? And why is so much GPU memory in system RAM?*
Scope: local GPU workloads, not cloud services. Decision models, vision, speech, LLM inference, training/fine-tuning (including Unsloth), graphics, and video all belong here. Visibility varies: process memory and engine activity are measured; identifying individual models and their work requires supporting evidence. A PyTorch/CUDA DLL alone cannot identify a model or prove training, and a mapped file does not prove that model is resident on the GPU or being exercised. CPU-only, NPU-only, and cloud workloads are out of scope.
Early, experimental software. Device and process counters are measurements; classifications
and GGUF-derived breakdowns are estimates. This does not dump VRAM or enumerate a game's textures.
The Releases page is where tagged builds
publish two portable ZIPs: gputaskman-VERSION-windows-x64.zip for Intel/AMD Windows PCs, and
gputaskman-VERSION-windows-arm64.zip for native Windows ARM64. These are separate native builds,
not a universal executable. If no release is published yet, use the source instructions below.
Extract the entire ZIP, keeping _internal beside gputaskman.exe. Open Windows Terminal
or PowerShell in the extracted folder:
.\gputaskman.exe
.\gputaskman.exe --once
.\gputaskman.exe --json
No Python, uv, CUDA Toolkit, model download, or installation is needed. A supported GPU with a
current Windows WDDM driver is required. Builds are currently unsigned; code signing
and an installer are not part of this initial distribution. Each ZIP includes licenses and a
.zip.sha256 companion file is published for integrity checks.
Use 64-bit Windows 10/11, an NVIDIA or AMD GPU with a current WDDM driver, and a terminal (Windows Terminal is recommended). Live workload checks have included an RTX 4080 SUPER and an RTX Spark N1X on Windows ARM64. CUDA workloads are supported on ARM64 with a compatible NVIDIA driver and ARM64 CUDA runtime.
AMD live check: Radeon 860M Graphics on Windows 11 Enterprise build 26300, AMD driver 32.0.22050.1003. During desktop/browser activity, WDDM reported per-process VRAM and AMD ADL reported GPU utilization, clocks, and ASIC power; temperature, memory activity, and PCIe readings were unavailable. Vulkan/ROCm workloads were not tested on this machine.
Install Git for Windows and uv if needed. With WinGet:
winget install --id Git.Git --exact
winget install --id astral-sh.uv --exact
Open a new PowerShell window so those tools are on PATH, then:
git clone https://github.com/shanselman/gputaskman.git
cd gputaskman
uv run --locked gputaskman
That's it. uv obtains the pinned Python version if needed, creates .venv, and installs
the locked dependencies. The first run needs internet access. There is no CUDA Toolkit,
Visual Studio, administrator session, API key, or model download required to monitor the GPU.
NVML ships with the NVIDIA driver; AMD ADL is supplied by supported AMD Windows drivers.
Already have Python 3.11+ and prefer pip?
git clone https://github.com/shanselman/gputaskman.git
cd gputaskman
py -m venv .venv
.\.venv\Scripts\python.exe -m pip install .
.\.venv\Scripts\gputaskman.exe
No PowerShell activation script or execution-policy change is needed. The pip route resolves compatible dependencies; the uv route uses the checked-in lockfile.
If an alternate package index makes --locked report a stale lockfile on an unchanged checkout,
uv run --frozen gputaskman uses the checked-in lockfile without re-resolving it. --frozen
skips the consistency check, so do not use it after changing dependencies.
Tagged releases include portable Linux builds: gputaskman-VERSION-linux-x64.tar.gz and
gputaskman-VERSION-linux-arm64.tar.gz. They need glibc 2.35 or newer (Ubuntu 22.04, Debian 12,
or newer) and an NVIDIA driver (or, on native Linux, an AMD GPU on the amdgpu driver), and work
natively, in containers, and in WSL:
tar -xzf gputaskman-VERSION-linux-x64.tar.gz
cd gputaskman-VERSION-linux-x64
./gputaskman
Or clone and run from source, in a Linux or WSL shell:
git clone https://github.com/shanselman/gputaskman.git
cd gputaskman
uv run --locked gputaskman
What can be measured depends on where it runs, and the UI says which mode it is in.
| | Native Linux | WSL, interop on (default) | WSL, interop off or --no-host |
|---|---|---|---|
| Device totals, load, temperature, power, clocks | NVML | NVML | NVML |
| Per-process VRAM | NVML, measured (in a container: owner matched, or ?) | Matched from the Windows host, marked or ? | n/a |
| Per-process GPU load | NVML (SM, encoder, decoder) | n/a for Linux processes | n/a |
| Spill / Paged | Not available (blank) | Windows rows only | Not available |
| WSL VM total, Windows apps | — | Windows host counters | — |
| Runtimes, model files, LLM breakdown | /proc//maps, command line | Same | Same |
Native Linux reads per-process memory from NVML's running compute and graphics process lists
and per-process SM, encoder, and decoder load from NVML utilization samples. Linux has no
equivalent of WDDM's shared-memory or commit counters, so Spill and Paged stay blank rather than
showing zero. Only processes you can inspect are listed; other users' processes need sudo.
JSON uses null for unavailable counters, not a measured zero: spill/commit/paged values on
native Linux, and per-process engine load for WSL Linux rows. Native NVML engine readings remain
available even if NVML hides that process's VRAM. Windows host rows retain their measured counters.
Containers (Docker, Kubernetes, rented GPU boxes) need one more step: NVML reports host
PIDs, which mean nothing in the container's /proc, and the container cannot see the host PID of
its own processes. gputaskman pairs NVML's unresolved PIDs with the container's processes that
have libcuda.so mapped (NVML-only tools such as nvidia-smi open the same device files but
never load libcuda). Both PID namespaces number processes in creation order, so the pairing is by
order: * when the counts match or a process starting while gputaskman runs pins it, ? when
NVML lists more compute processes than the container has (another container on the same GPU).
Per-process GPU load follows the match. Anything left over is shown as H:,
outside this container (for example, the host's display server), and is never looked up locally.
Live check, on a Vast.ai Docker container (Ubuntu 22.04, RTX 3060 Ti, driver 580.82.09): two
PyTorch jobs already running at startup, a third started while watching, and one killed, were all
matched to the right container PIDs with their NVML sizes (1.12, 2.52 and 1.59 GB) and live GPU%.
An Ollama qwen3:0.6b runner was detected and named from Ollama's store with api+mapped+cmdline
evidence, its weights / KV-cache / compute split shown, and the TUI rendered. Bare-metal Linux
(same PID namespace, no matching needed) is covered by tests but has not been run on hardware.
AMD GPUs on native Linux (the amdgpu driver) need no ROCm, AMD SMI, or extra package: the
kernel already exposes what's needed.
| | Source |
|---|---|
| Device VRAM, GTT, load, temperature, power, clocks, fan, PCIe link | /sys/class/drm/card*/device and its hwmon |
| Per-process VRAM and GTT | drm-resident-vram / drm-resident-gtt (older kernels: drm-memory-) and drm-shared- in /proc//fdinfo/ |
| Per-process engine load (gfx, compute, video) | drm-engine-* busy time, sampled twice (n/a until a new client has two samples); n/a for ROCm/HIP processes (see below) |
GTT is GPU-accessible system RAM, so it fills the SPILL column (and shared (in system RAM) for
the device), like WDDM's non-local usage. On an APU (an integrated GPU, detected by amdgpu not
reporting a VRAM vendor, a heuristic validated on one APU) GTT is the GPU's normal memory and "VRAM"
is only a RAM carve-out, so GTT is still shown but never flagged as spill, and an LLM's memory is its
VRAM plus GTT. The SDMA engine (dma) fills the COPY column. Paged stays blank: there is no commit
counter. VRAM and SPILL are charged to a process only when nothing else can hold its bytes: each of
its DRM clients has exactly one visible holder, was opened through a render node (/dev/dri/renderD*),
and reports zero bytes in every drm-shared-* region. Then its resident VRAM and GTT are its own and add
up without double counting. Otherwise the process shows VRAM and SPILL as n/a (null in JSON, with
vram_unattributed_reason) and its bytes stay in unattributed:
n/a too.
drm-shared-* counts a buffer bydrm-resident-* counts where buffers are, so
resident minus shared is not private memory and is never computed.
/dev/dri/card*, typically a compositor): root-owned logind keeps a copy of thatdrm-shared-vram/drm-shared-gtt.n/a too).n/a too). Expected to be rare on a desktop (~9 ms for ~8,000 fds,
not yet re-measured with this rule); one-shot output always scans fully.
The inspector and JSON (vram_resident_bytes, gtt_resident_bytes) still show every buffer the
process can reach, shared ones included; the same buffer can appear under several processes, so these
are a reference and are never summed. Unparseable or missing values are unknown (null), not 0. amdgpu has no device-wide
video engine counter, so the device's encode/decode load stays N/A; per-process video load is
measured. On VCN 4 and later (RDNA3 and newer, including the RX 9070) decode and encode share one
ring, so it is reported as video rather than split. Only processes you can inspect are listed; the header and JSON (process_status) say how many could not be, and sudo includes other users'. --gpu 1
selects the next card, such as an APU's integrated GPU next to a discrete one. A ROCm/HIP process
(tagged HIP) has its VRAM in fdinfo like any other. Its GPU% is not: HIP submits compute through user-mode queues on /dev/kfd, which the kernel
does not time per process, so a process holding /dev/kfd shows engines as n/a (null in JSON)
rather than a measured-looking 0. The device's AMD gfx load does include that work.
This path is native-Linux only; under WSL the GPU is /dev/dxg, with no DRM driver involved.
Live check, bare-metal Arch-based Linux (kernel 7.2.15, amdgpu), Radeon RX 9070-series (Navi 48)
plus a Radeon 610M iGPU: both cards were found, named, and read; VAAPI HEVC encode and decode with ffmpeg
each showed as a video row at ~95-100% video load (on the RX 9070 both were charged to amdgpu's
unified enc ring, hence video); desktop processes' VRAM summed
to less than the card's used VRAM, with the compositor's imported windows listed as shared.
llama.cpp's ROCm server image (ghcr.io/ggml-org/llama.cpp:server-rocm, Qwen3-4B-Instruct-2507
Q4_K_M, -ngl 99 -c 8192, next to a running game) showed as an LLM row with llama.cpp+ggml+HIP
and 3.95 GB of VRAM, matching the 2.49 GB of weights plus 1.21 GB of f16 KV cache plus compute
buffers, and the 4.11 GB KFD reports for the process in /sys/class/kfd/kfd/proc//vram_*.
While it generated at 103 tok/s the device read 99% gfx and 339 W, but fdinfo had no engine lines
for it, which is why ROCm rows show engines as n/a. PyTorch-ROCm has not been run on this path.
That check predates the stricter attribution above (no subtraction of shared bytes; render-node,
single-holder and complete-scan requirements; per-client timestamps; PID-reuse checks), which is
covered by unit tests only and not yet validated on AMD hardware.
WSL is different, because Windows owns the GPU. Linux cannot see how much VRAM its own
processes use: nvidia-smi lists no processes, NVML's per-process samples carry Windows PIDs
(never looked up in Linux's /proc), and Windows charges all Linux GPU memory to the VM worker
process, vmwp.exe. When WSL interop is enabled (/proc/sys/fs/binfmt_misc/WSLInterop reads
enabled), gputaskman starts one long-lived powershell.exe that reads the Windows GPU counters
through the same PDH array API as the Windows backend and streams them back once a second:
vmwp.exe) is the exact total of Linux GPU memory, across every distro, WSLg, andW: rows with their VRAM, spill, paged, and engine load.vmwp.exe's GPU contexts to Linux processes (below).starting until then, and --once waits
for it. The host adapter is paired with the NVML device by memory usage, because WSL's adapter
LUIDs differ from the host's. An ambiguous pairing shows unmatched instead of guessing. With other
Hyper-V VMs or Windows Sandbox running, the row is labeled VM worker because it cannot be tied
to WSL alone. --no-host turns the host stream off; without interop you get device-wide numbers
and a list of the Linux processes that hold /dev/dxg, with VRAM shown as n/a.
vmwp.exe exposes one GPU-memory instance per guest GPU context, all with the same name: sizes
without owners. Measured on WSL2 with driver 610.88, every Linux process that opens /dev/dxg
gets exactly one context (an NVML-only process too, at 0 bytes), and Windows lists them newest
first, keeping that order as contexts come and go. Contexts from outside this distro (WSLg, other
distros, Docker, services you cannot inspect) are interleaved by their own age.
gputaskman follows the contexts from sample to sample and labels them with evidence:
| Marker | Meaning | Established by |
|---|---|---|
| * matched | Windows' exact size; the owner is inferred, and only one explanation fits (or every one that fits gives the same size) | A new Linux GPU process and a new context appearing together; elimination; this monitor's own context being the only zero-byte candidate at startup; candidate contexts that are exactly the same size |
| ? guess | Heuristic owner for processes that were already running | Newer process ↔ newer context, outside contexts assumed oldest; cached foreign sizes can rank extra candidates but never establish ownership |
| n/a | No context could be assigned | For example, a process that has not created its GPU context yet |
A guess is recomputed every refresh and never counts as evidence for itself. An exited process's
context is held aside until it disappears, so it is not handed to a newcomer, and a context that
grows by gigabytes between refreshes (weights uploading) keeps an established owner. Multiple
zero-byte contexts at startup do not pin the monitor to an arbitrary one that might later grow.
Foreign sizes observed while only the monitor is running are cached per WSL boot in
~/.cache/gputaskman/, but remain hints: a process may exit while the monitor is off and a local
process may reuse its size. Observed foreign-context exits and idle samples clear obsolete hints.
The matched size also feeds VRAM sorting, initial model selection, the bounded model-file scan
priority, and the LLM weights / KV-cache breakdown. Inferred Linux rows remain below the VM total
and are never added to it again. The inspector and --json (vram_inferred_by) say which kind
of match each row has.
In one live check, a 2 GB and a 5 GB PyTorch allocation were matched to the right PIDs at 2.119 GiB and 4.914 GiB: the allocator's own figure plus about 0.26 GiB of CUDA context. That is one machine and driver, not a guarantee. A process that started long before it first used the GPU can break the start-order guess, and processes started in the same refresh are ordered by guess unless their sizes match.
With flakes enabled, run directly from this checkout:
nix run path:.
nix run path:. -- --list-gpus
nix run path:. -- --once
nix run path:. -- --json
Build both gputaskman and its gtm alias with nix build path:. (executables are in
result/bin/). The flake provides packages for x86_64-linux and aarch64-linux; flake.lock
pins nixpkgs. Dependencies come from nixpkgs, independently of uv.lock. No pip installation,
virtual environment, CUDA Toolkit, or ROCm installation is needed. GPU drivers remain supplied by
the host, never bundled with the package. NVIDIA's nixpkgs Python binding finds NVML through
/run/opengl-driver/lib; AMD uses kernel sysfs and DRM fdinfo interfaces directly.
For source development and tests:
nix develop path:.
python -m gputaskman --once
python -m unittest discover -s tests -q
nix flake check path:. builds the package and runs the same hardware-independent tests.
For a flake-based NixOS configuration, add this repository as a gputaskman input, then include
inputs.gputaskman.packages.${pkgs.stdenv.hostPlatform.system}.default in
environment.systemPackages. Enable your GPU's normal NixOS driver configuration first.
The flake was contributed and checked on x86_64 NixOS 26.05; CI does not build it, and ARM64 has
not been validated.
Run from a clone (uv run gputaskman); there is no portable macOS download yet. Apple GPUs share
one pool of memory with the CPU, so there is no VRAM to split and no spill/commit counters. What
macOS exposes without root:
| Column | Source | Who |
|---|---|---|
| GPU memory (header) | IOAccelerator PerformanceStatistics: Alloc system memory (all GPU allocations) out of physical RAM | device |
| GPU% (header) | Device Utilization % | device |
| GPU% | Each Metal client (AGXDeviceUserClient) names its creator PID and keeps a cumulative accumulatedGPUTime; the rate between samples, per client (a closed client never hides the others' work) | every process |
| VRAM | footprint: the process's memory macOS charges to graphics (the (graphics) categories: Metal buffers, textures) | your own processes |
| Runtime, model files | Mapped files from proc_pidinfo region walks (psutil has no memory maps on macOS): libggml*.dylib, libllama*.dylib, libmlx*.dylib, libtorch_cpu.dylib, the Metal driver bundle | your own processes |
Other users' processes (WindowServer, system daemons) show GPU% with memory n/a: footprint needs
root for them. Idle ones are left out of the table, except WindowServer. Run with sudo to measure
every process's memory. footprint takes ~70 ms per process, so it runs in a background thread:
busy processes and new ones every pass (~2 s), idle ones every 30 s. A new process shows n/a for a
second or two until its first measurement; a single failed measurement keeps the last size, and three
in a row back off for a minute. Measurements are tied to the process's start time, so a reused PID
never shows the previous process's numbers.
Metal reports one GPU time per process, with no 3D/compute/copy/video split, so those columns show
n/a; a Metal process above 10% GPU is classified 3D/game unless something more specific applies
(AI runtime, browser, compositor). Spill, paged, clocks, power, and temperature are not available, so
the chart picker offers only GPU and GPU memory. Handy's log is read from
~/Library/Logs/com.pais.handy/handy.log.
Live check on an M4 Mac mini (macOS 26.3.1): a PyTorch MPS job with a 2 GiB buffer and a matmul loop
showed Python AI PyTorch+Metal 3.06 GB 99%, with device utilization at 99% and allocated GPU
memory rising by the same amount.
Scans skip other apps' sandbox containers (~/Library/Containers, ~/Library/Group Containers) and
system files without opening them: opening a file in a protected container blocks while macOS waits
for a privacy consent prompt.
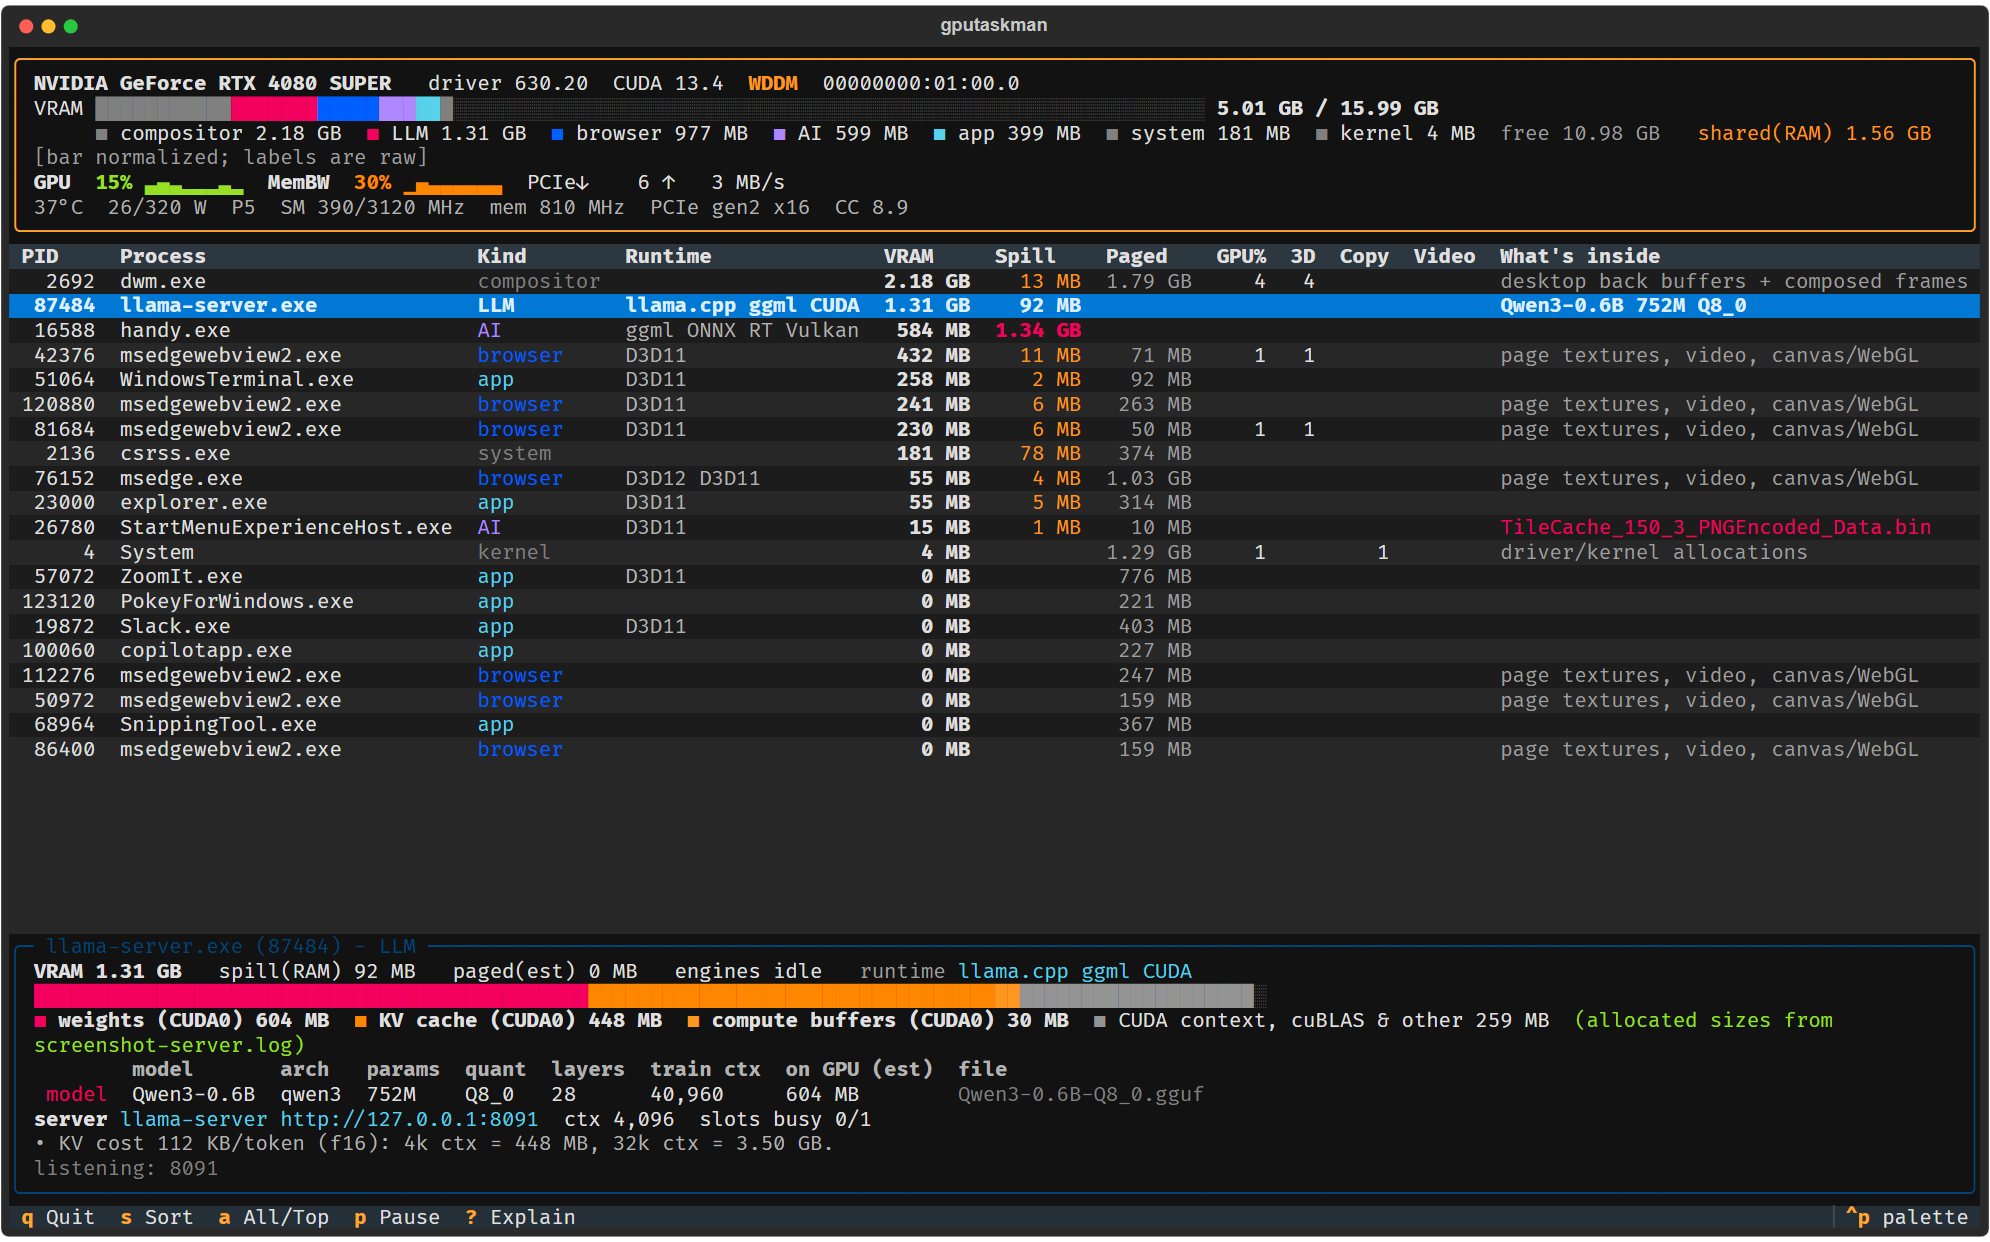
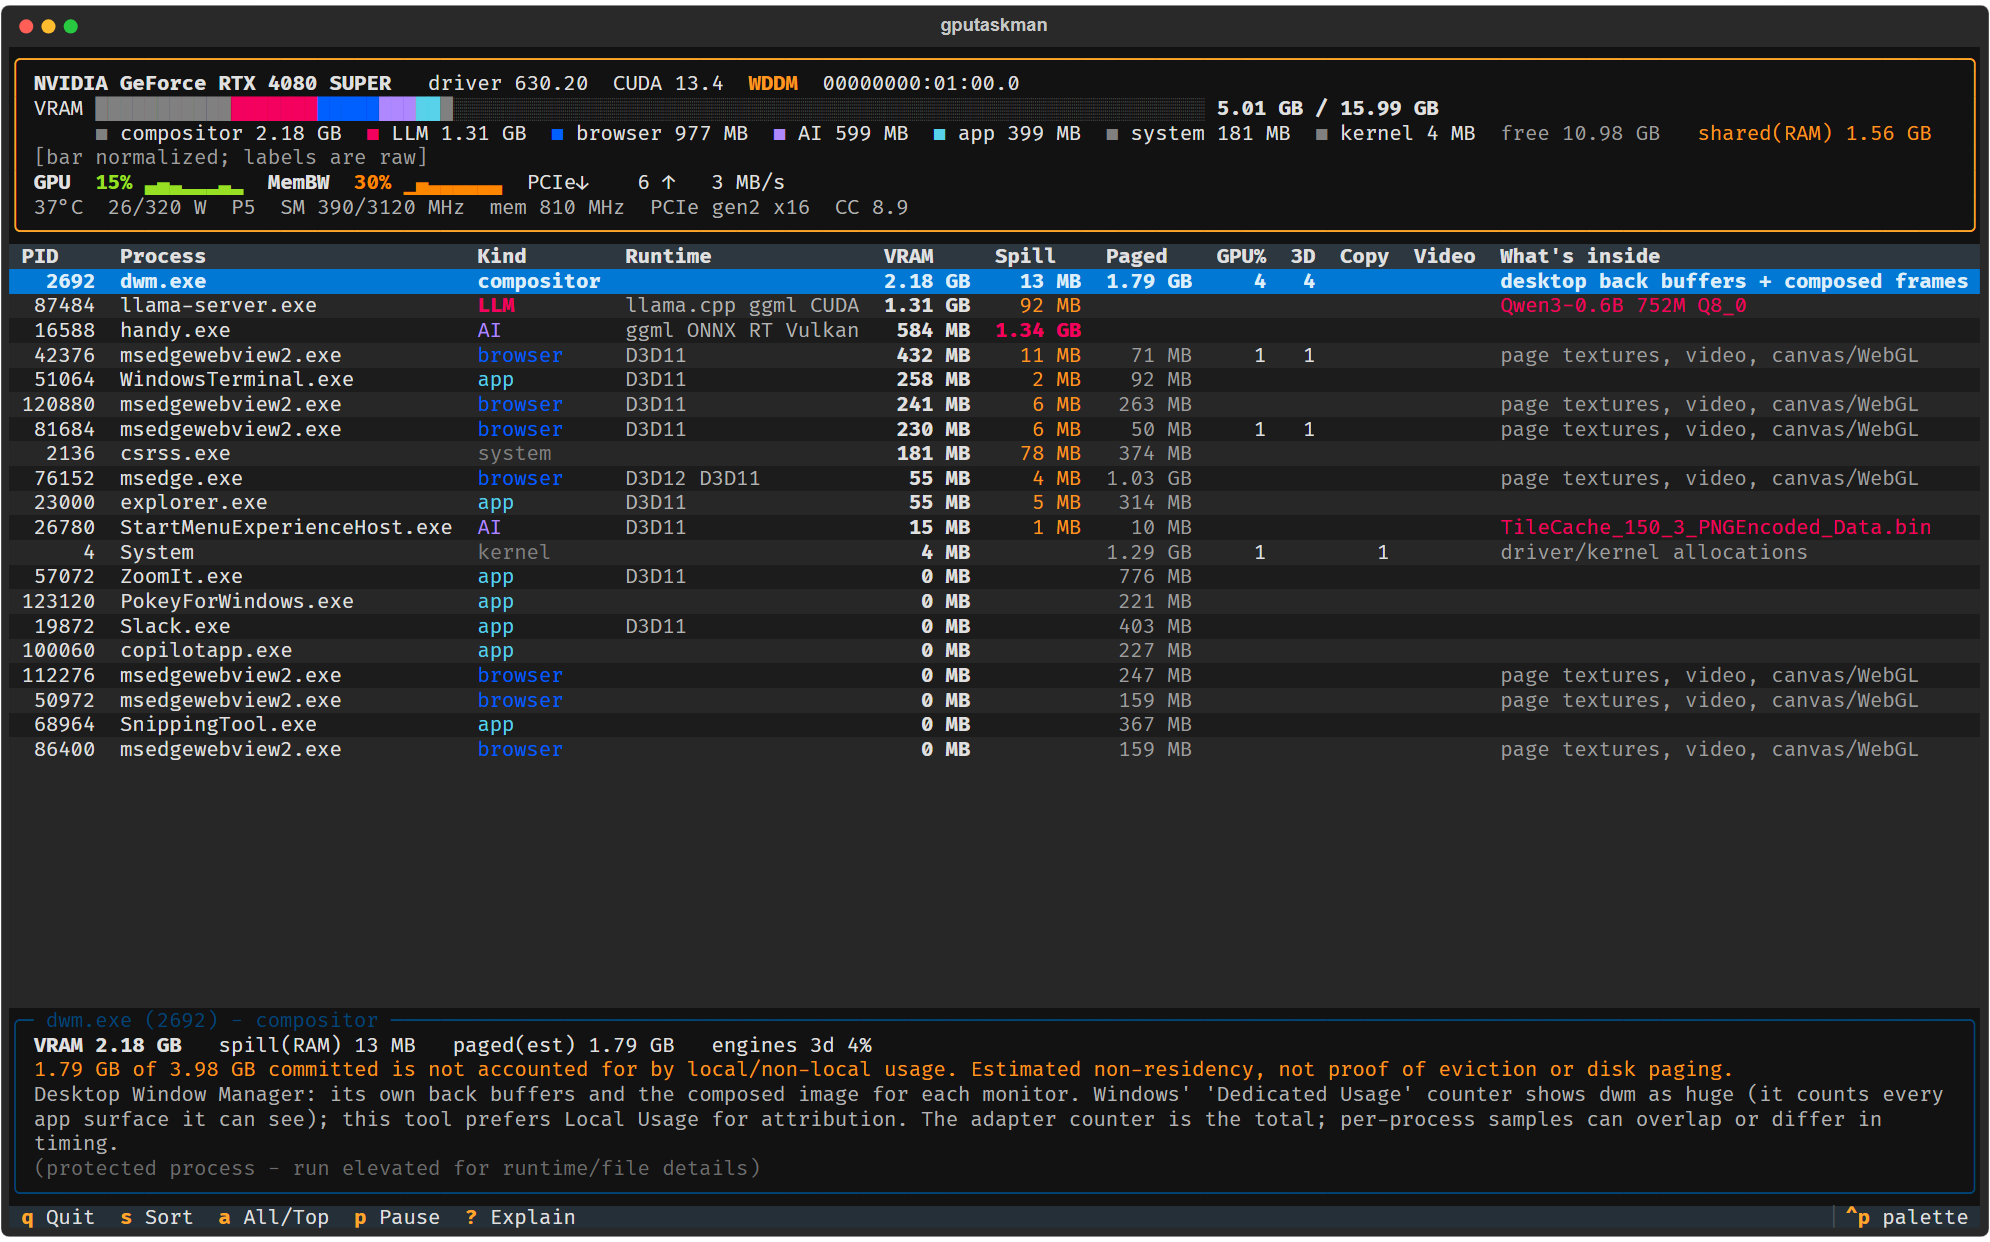
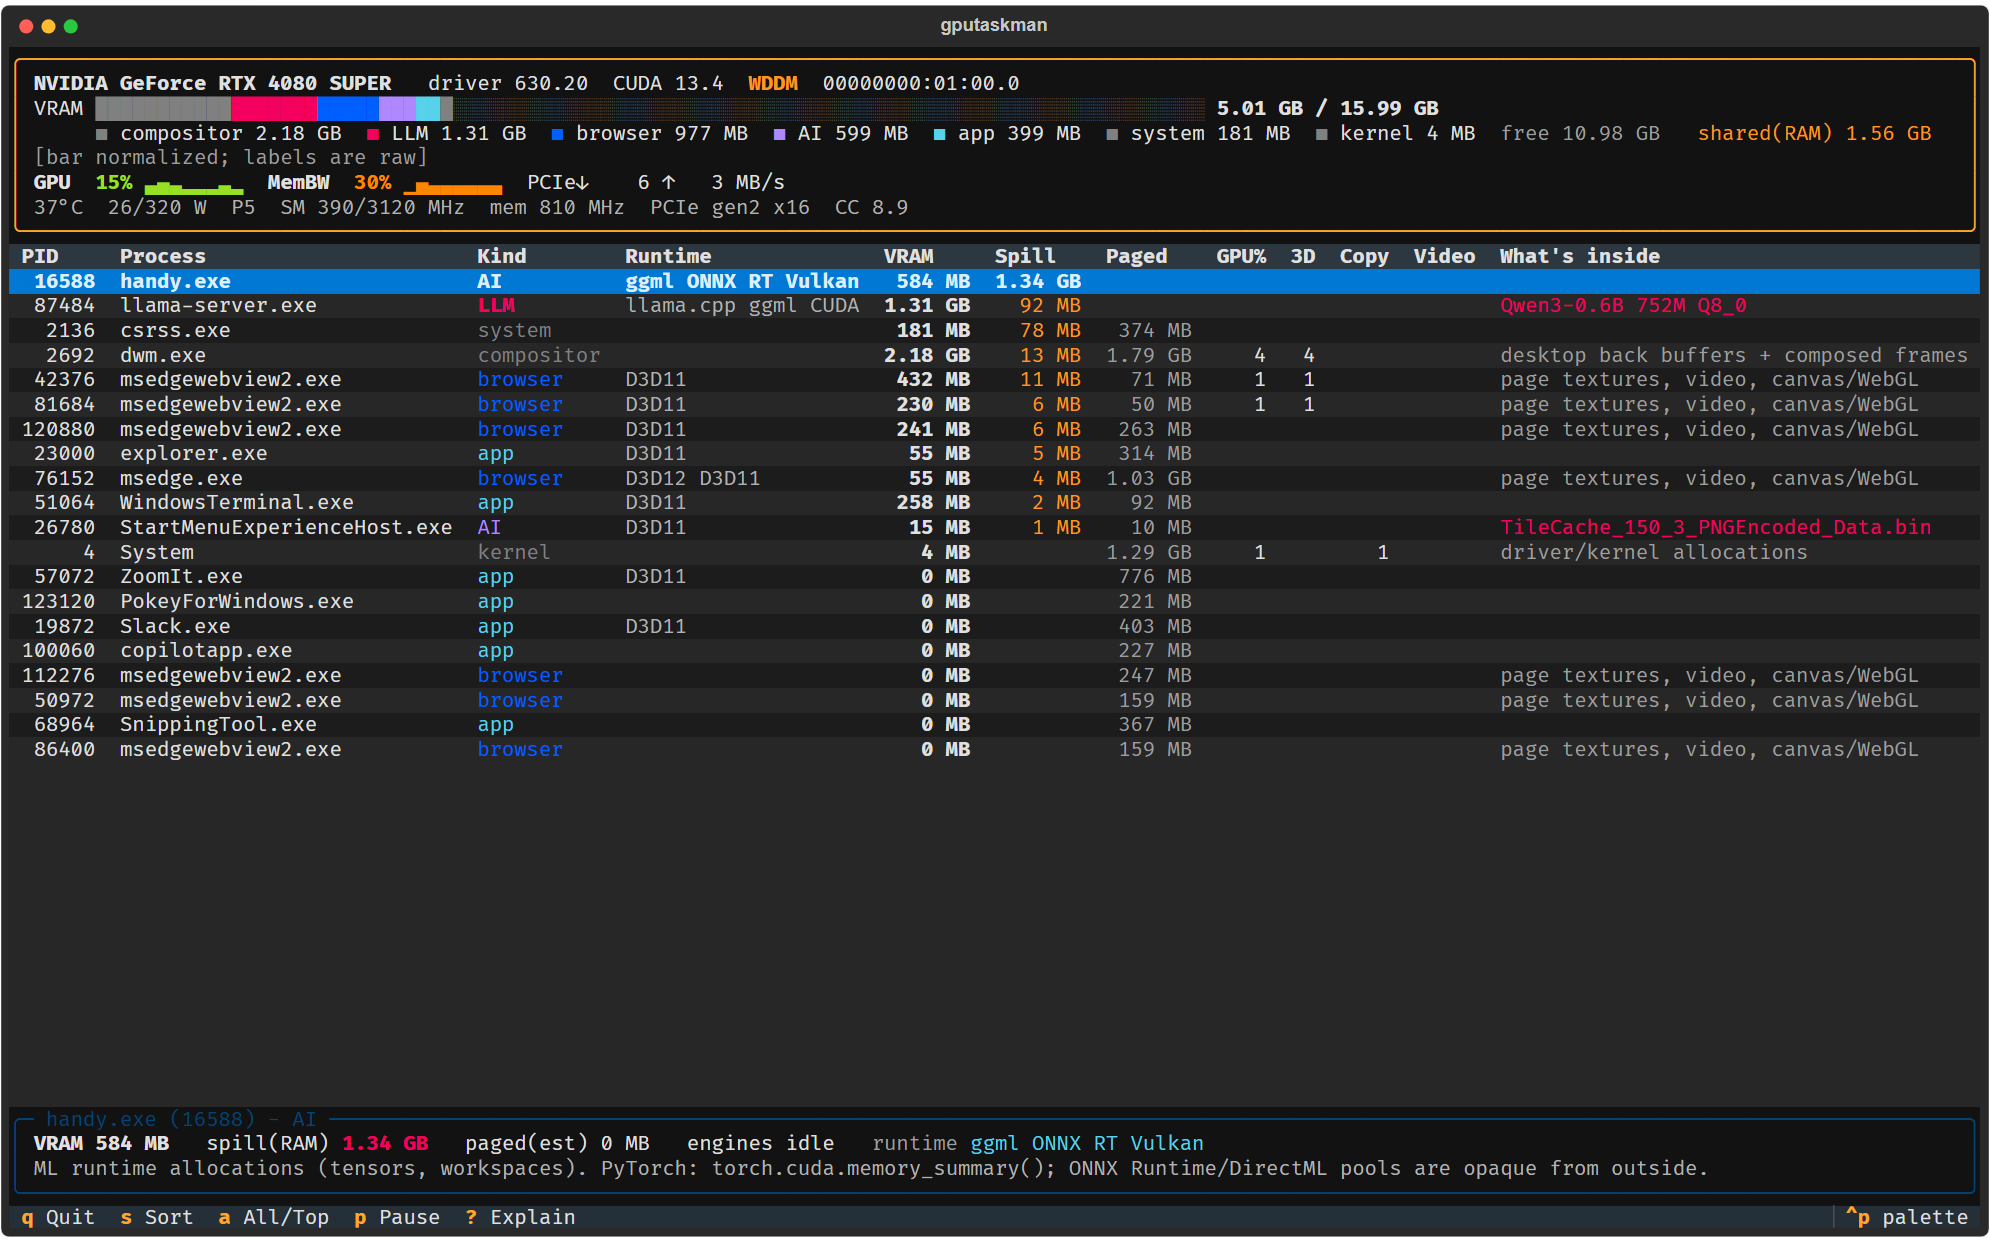
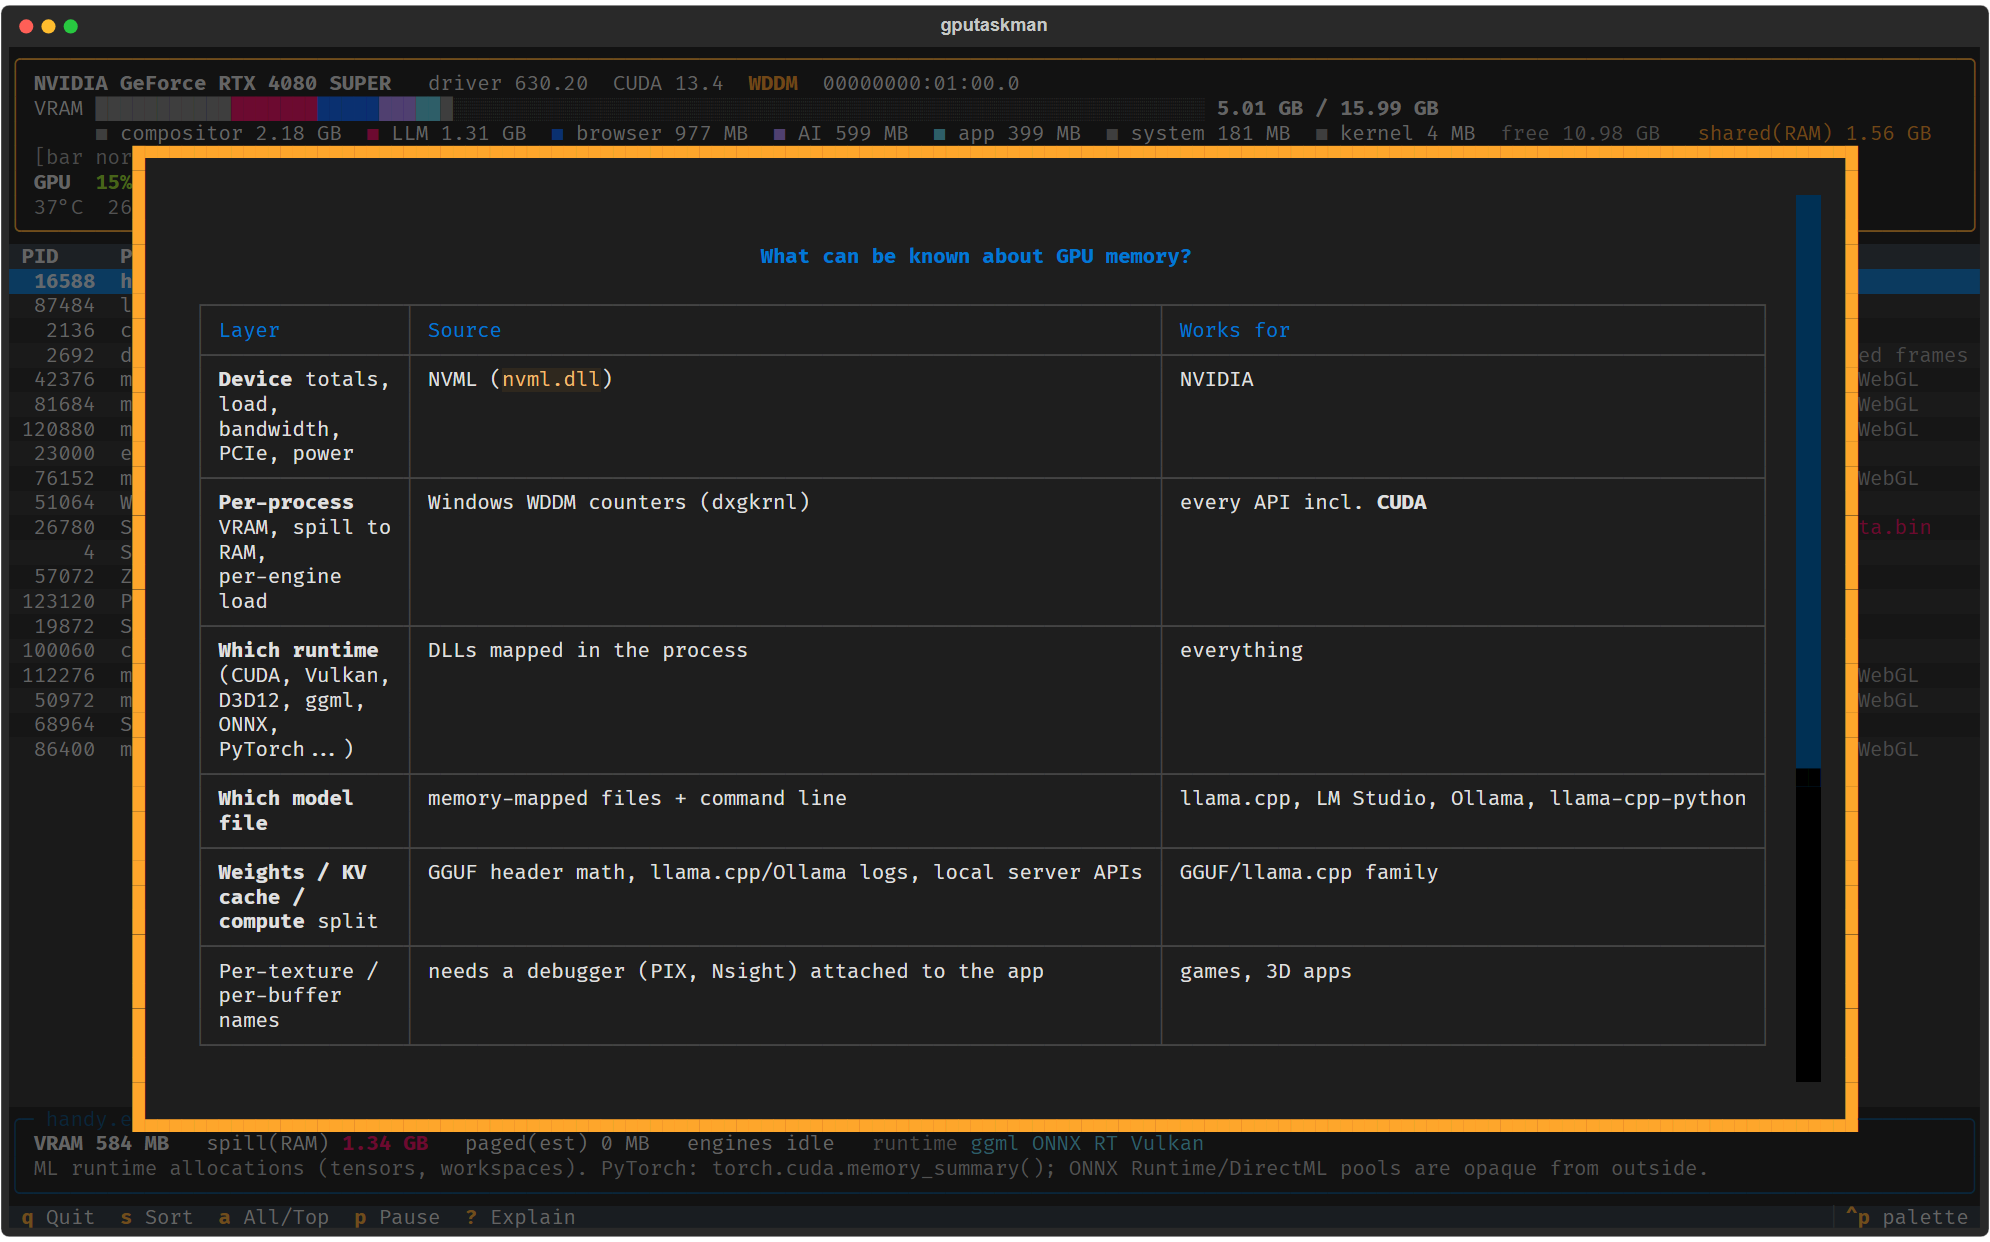
These are captures of real local workloads through Textual's screenshot renderer, not mock data. Full filesystem paths and command lines were omitted in the capture copy. Measurements vary with the workload; the examples are not benchmarks.
The compositor, without treating all shared surfaces as its private VRAM
GPU-accessible system RAM, sorted by the Spill column
An explanation of what is measured, inferred, and unavailable
uv run --locked gputaskman              # live TUI
uv run --locked gtm                     # shorter alias
uv run --locked gputaskman -i 2         # sample every two seconds
uv run --locked gputaskman --once       # one text snapshot
uv run --locked gputaskman --json       # one JSON snapshot; implies --once
uv run --locked gputaskman diff before.json after.json   # compare two --json snapshots
uv run --locked gputaskman --no-host    # WSL: don't read Windows host counters through interop
uv run --locked gputaskman --help
| Key | Action |
|---|---|
| Up / Down | Select a process and inspect it |
| s | Cycle sort: VRAM, GPU%, spill, paged, name |
| c | Cycle all charts or a single metric (also available in the Charts dropdown) |
| a | Switch between top and all collected processes |
| p | Pause / resume collection |
| ? | Explain the counters and their limits |
| Escape | Close help |
| q | Quit |
A
→ →
 →
 →
 →
 →
 →
 →