

1
 →
→
Open source implementation and extension of Google Research’s PaperBanana for automated academic figures, diagrams, and research visuals, expanded to new domains like slide generation.
llmsresearch/paperbanana is an open-source project on GitHub, mainly written in Python. Open source implementation and extension of Google Research’s PaperBanana for automated academic figures, diagrams, and research visuals It currently holds 2,375 stars and 335 forks with 0 open issues, and was last pushed on an unknown date (repository created unknown).
AI Homed tracks it on the AI Image Projects board and on the AI AI Image Projects list.

|
PaperBananaAutomated Academic Illustration for AI Scientists
|
---
Disclaimer: This is an unofficial, community-driven open-source implementation of the paper
"PaperBanana: Automating Academic Illustration for AI Scientists" by Dawei Zhu, Rui Meng, Yale Song,
Xiyu Wei, Sujian Li, Tomas Pfister, and Jinsung Yoon (arXiv:2601.23265).
This project is not affiliated with or endorsed by the original authors or Google Research.
The implementation is based on the publicly available paper and may differ from the original system.
An agentic framework for generating publication-quality academic diagrams and statistical plots from text descriptions. Supports OpenAI (GPT-5.2 + GPT-Image-1.5), Azure OpenAI / Foundry, Google Gemini, and Atlas Cloud providers.
paperbanana plot-batch runs many statistical plots from one manifest (CSV/JSON per item)paperbanana[pdf] / PyMuPDF), with per-page selectionpaperbanana studio) for diagrams, plots, evaluation, batch, and run browser/generate-diagram, /generate-plot, and /evaluate-diagram
Learning LLM concepts? We also publish 211 free visual cards on attention, RAG, agents, and inference. Read them online.

Atlas Cloud is a full-modal AI inference platform that gives developers a single AI API to access video generation, image generation, and LLM APIs. Instead of managing multiple vendor integrations, you connect once and get unified access to 300+ curated models across all modalities.
Check out Atlas Cloud's new coding plan promotion for more budget-friendly API access: https://www.atlascloud.ai/console/coding-plan
---
Try it in your browser: the
Colab quickstart notebook
walks through install → API key → diagram generation end-to-end, no local setup required.
pip install paperbanana
Or install from source for development:
git clone https://github.com/llmsresearch/paperbanana.git
cd paperbanana
pip install -e ".[dev,openai,google]"
Build the image from a clone of the repo and pass your API key at runtime:
docker build -t paperbanana .
docker run --rm -e GOOGLE_API_KEY paperbanana generate --help
To generate a diagram, mount your input and an outputs folder into /work:
docker run --rm -e GOOGLE_API_KEY \
  -v "$(pwd)/method.txt:/work/method.txt:ro" \
  -v "$(pwd)/outputs:/work/outputs" \
  paperbanana generate --input method.txt --caption "Overview of our framework"
cp .env.example .env
Edit .env and add your API key:
OPENAI_API_KEY=your-key-here
GOOGLE_API_KEY=your-key-here
# For Azure OpenAI / Foundry:
OPENAI_BASE_URL=https://.openai.azure.com/openai/v1
# Optional Gemini overrides:
GOOGLE_BASE_URL=https://your-gemini-proxy.example.com
GOOGLE_VLM_MODEL=gemini-2.5-flash
GOOGLE_IMAGE_MODEL=gemini-3-pro-image-preview
Or use the setup wizard for Gemini:
paperbanana setup
paperbanana generate \
  --input examples/sample_inputs/transformer_method.txt \
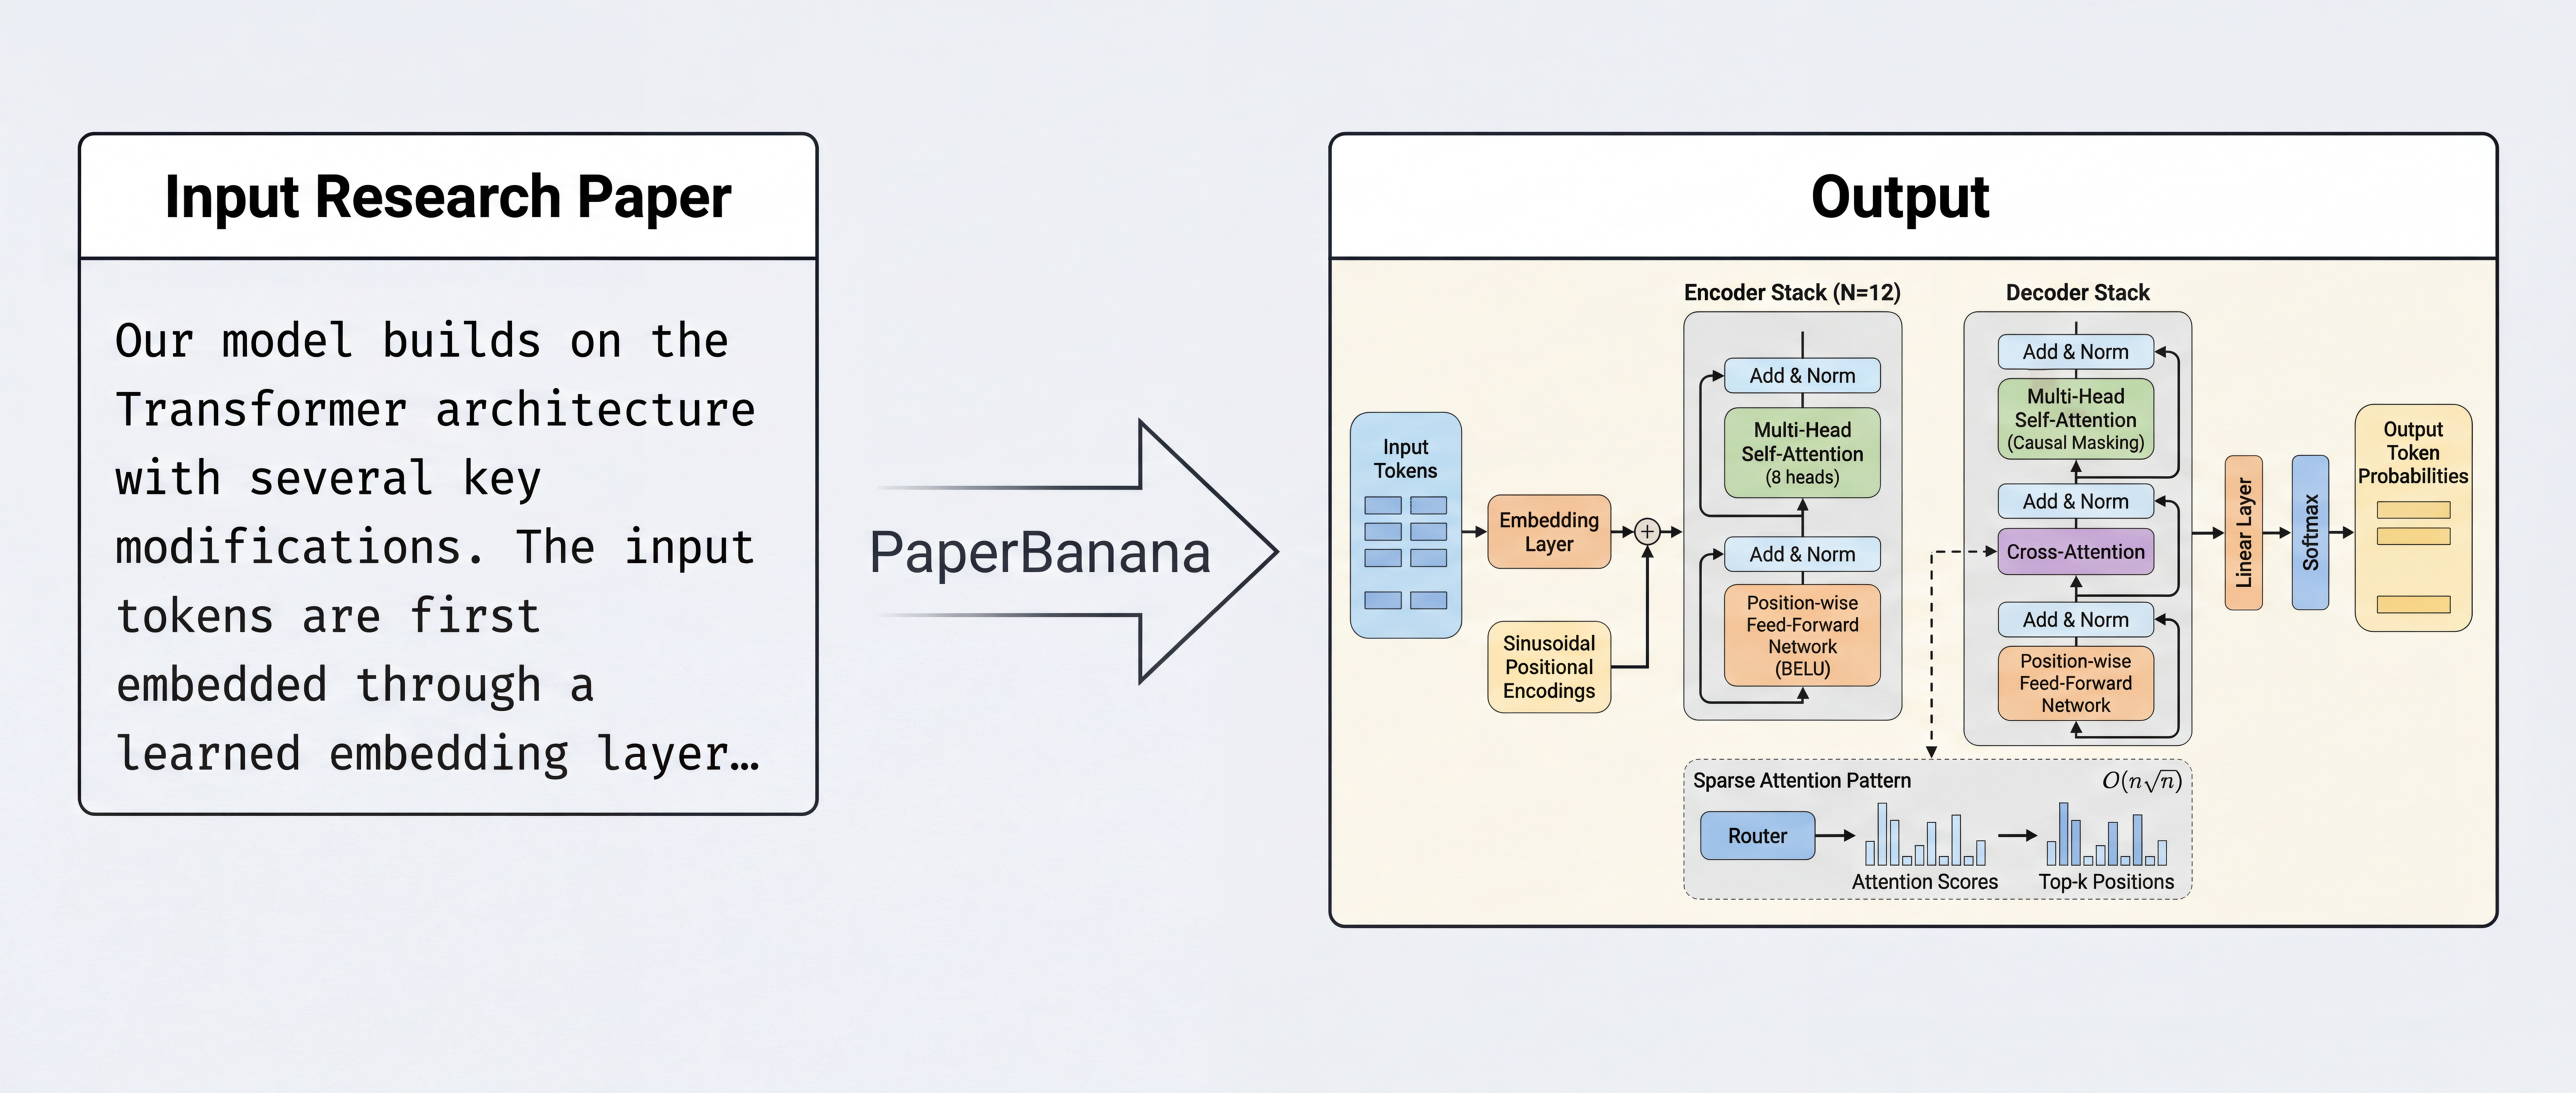
  --caption "Overview of our encoder-decoder architecture with sparse routing"
With input optimization and auto-refine:
paperbanana generate \
  --input my_method.txt \
  --caption "Overview of our encoder-decoder framework" \
  --optimize --auto
Output is saved to outputs/run_/final_output.png along with all intermediate iterations and metadata.
Install the optional Gradio dependency, then start the app:
pip install 'paperbanana[studio]'
paperbanana studio
Open the URL shown in the terminal (default http://127.0.0.1:7860/). The Studio exposes the same workflows as the CLI: methodology diagrams, statistical plots, comparative evaluation, continuing a prior run, batch manifests (methodology or plot batch via the Batch tab), and a simple browser for run_* / batch_* output folders. Use --host, --port, --config, and --output-dir as needed.
---
PaperBanana implements a multi-agent pipeline with up to 7 specialized agents:
Phase 0 -- Input Optimization (optional, --optimize):
0. Input Optimizer runs two parallel VLM calls:
1. Retriever selects the most relevant reference examples from a curated set of 13 methodology diagrams spanning agent/reasoning, vision/perception, generative/learning, and science/applications domains 2. Planner generates a detailed textual description of the target diagram via in-context learning from the retrieved examples 3. Stylist refines the description for visual aesthetics using NeurIPS-style guidelines (color palette, layout, typography)
Phase 2 -- Iterative Refinement:
4. Visualizer renders the description into an image
5. Critic evaluates the generated image against the source context and provides a revised description addressing any issues
6. Steps 4-5 repeat for a fixed number of iterations (default 3), or until the critic is satisfied (--auto)
PaperBanana supports multiple VLM and image generation providers:
| Component | Provider | Model | Notes |
|-----------|----------|-------|-------|
| VLM (planning, critique) | OpenAI | gpt-5.2 | Default |
| Image Generation | OpenAI | gpt-image-1.5 | Default |
| VLM | Atlas Cloud | deepseek-ai/DeepSeek-V3-0324 | OpenAI-compatible chat endpoint |
| Image Generation | Atlas Cloud | openai/gpt-image-2/text-to-image | Async prediction API |
| VLM | Google Gemini | gemini-2.5-flash | Low cost |
| Image Generation | Google Gemini | gemini-3-pro-image-preview | $0.134/image (1K) |
| VLM / Image | OpenRouter | Any supported model | Flexible routing |
Azure OpenAI / Foundry endpoints are auto-detected — set OPENAI_BASE_URL to your endpoint.
Gemini-compatible gateways are also supported — set GOOGLE_BASE_URL when needed.
Atlas Cloud uses ATLASCLOUD_BASE_URL=https://api.atlascloud.ai/v1 for chat and ATLASCLOUD_IMAGE_BASE_URL=https://api.atlascloud.ai/api/v1 for image generation.
Atlas Cloud official site: https://www.atlascloud.ai/?utm_source=github&utm_medium=link&utm_campaign=paperbanana
Recommended Atlas LLM models for ATLASCLOUD_VLM_MODEL:
deepseek-ai/DeepSeek-V3-0324 (default)openai/gpt-4oopenai/gpt-4.1google/gemini-2.5-flashanthropic/claude-sonnet-4.5-20250929ATLASCLOUD_VLM_MODEL.
Recommended Atlas image models for ATLASCLOUD_IMAGE_MODEL:
openai/gpt-image-2/text-to-imageopenai/gpt-image-2/editbaidu/ERNIE-Image-Turbo/text-to-imageblack-forest-labs/flux-devblack-forest-labs/flux-schnellqwen/qwen-imagepaperbanana generate -- Methodology Diagrams# Basic generation
paperbanana generate \
--input method.txt \
--caption "Overview of our framework"
With input optimization and auto-refine
paperbanana generate \
--input method.txt \
--caption "Overview of our framework" \
--optimize --auto
Continue the latest run with user feedback
paperbanana generate --continue \
--feedback "Make arrows thicker and colors more distinct"
Continue a specific run
paperbanana generate --continue-run run_20260218_125448_e7b876 \
--iterations 3
PDF as input (install PyMuPDF: pip install 'paperbanana[pdf]')
paperbanana generate \
--input paper.pdf \
--caption "Overview of our method" \
--pdf-pages "3-8"
Guide generation with a reference/sketch image (repeatable)
paperbanana generate \
--input method.txt \
--caption "Overview of our framework" \
--image sketch.png --image prior_figure.png
| Flag | Short | Description |
|------|-------|-------------|
| --input | -i | Path to methodology text file or PDF (required for new runs) |
| --caption | -c | Figure caption / communicative intent (required for new runs) |
| --image | | Reference/sketch image (hand-drawn sketch, whiteboard photo, prior figure) that guides the Planner. Repeatable for multiple images |
| --output | -o | Output image path (default: auto-generated in outputs/) |
| --iterations | -n | Number of Visualizer-Critic refinement rounds (default: 3) |
| --num-candidates | -k | Generate N candidate images in parallel, 1-8 (default: 1). Planning runs once; refinement fans out per candidate with seed offsets. Outputs land in candidates/cand_/; the run-root final_output is candidate 1. Cost estimates and --budget account for the fan-out |
| --auto | | Loop until critic is satisfied (with --max-iterations safety cap) |
| --max-iterations | | Safety cap for --auto mode (default: 30) |
| --optimize | | Preprocess inputs with parallel context enrichment and caption sharpening |
| --continue | | Continue from the latest run in outputs/ |
| --continue-run | | Continue from a specific run ID |
| --feedback | | User feedback for the critic when continuing a run |
| --pdf-pages | | PDF input only: 1-based pages (e.g. 1-5, 2,4,6-8; default: all) |
| --vlm-provider | | VLM provider name (default: openai) |
| --vlm-model | | VLM model name (default: gpt-5.2) |
| --image-provider | | Image gen provider (default: openai_imagen) |
| --image-model | | Image gen model (default: gpt-image-1.5) |
| --format | -f | Output format: png, jpeg, or webp (default: png) |
| --config | | Path to YAML config file (see configs/config.yaml) |
| --verbose | -v | Show detailed agent progress and timing |
| --progress-json | | Emit JSON progress events to stdout during generation |
paperbanana plot -- Statistical Plotspaperbanana plot \
--data results.csv \
--intent "Bar chart comparing model accuracy across benchmarks"
| Flag | Short | Description |
|------|-------|-------------|
| --data | -d | Path to data file, CSV or JSON (required) |
| --intent | | Communicative intent for the plot (required) |
| --output | -o | Output image path |
| --iterations | -n | Refinement iterations (default: 3) |
| --vlm-provider | | VLM provider name |
| --vlm-model | | VLM model name |
Plots are rendered via VLM-generated matplotlib code — no image-generation provider or credentials are required.
paperbanana venues -- Custom Venue Style Packs--venue selects a venue style pack: a directory with methodology_style_guide.md, plot_style_guide.md, and an optional venue.yaml. Built-in packs (neurips, icml, acl, ieee) ship with PaperBanana; you can add your own under ~/.config/paperbanana/venues/ (override with --venue-dir or PAPERBANANA_VENUE_DIR) without touching the repo:
# 1. Scaffold a pack (seeds both guides from the NeurIPS templates)
paperbanana venues init mylab
2. Edit the style guides — or generate them from a corpus of example figures:
paperbanana guidelines synthesize --reference-set ./examples \
--output ~/.config/paperbanana/venues/mylab/methodology_style_guide.md
3. Use it anywhere --venue is accepted
paperbanana generate --input method.txt --caption "Overview" --venue mylab
See everything that's available (built-in + user, with source)
paperbanana venues list
venue.yaml (all fields optional):
display_name: "My Lab Style" # shown by paperbanana venues list
aspect_ratio: "16:9" # default --aspect-ratio for this venue's runs
fonts: # preferred fonts, appended to the style guides
- "Helvetica"
On a name clash, built-in packs win — user packs cannot shadow built-in venues. Unknown venue names fail fast with the list of available packs from both sources.
paperbanana batch -- Batch GenerationGenerate multiple methodology diagrams from a single manifest file (YAML or JSON). Each item runs the full pipeline; outputs are written under outputs/batch_/run_/ and a batch_report.json summarizes all runs.
paperbanana batch --manifest examples/batch_manifest.yaml --optimize
Manifest format (YAML or JSON with an items list):
items:
- input: path/to/method1.txt
caption: "Overview of our encoder-decoder"
id: fig1
- input: method2.txt
caption: "Training pipeline"
id: fig2
- input: paper.pdf
caption: "System overview"
id: fig3
pdf_pages: "4-9" # optional; PDF inputs only
Paths in the manifest are resolved relative to the manifest file's directory.
Composite figures: Add an optional composite section to automatically stitch all generated panels into a single labeled figure after the batch completes:
composite:
layout: "1x3" # rows x cols, or "auto"
labels: auto # (a), (b), (c)... or explicit list, or null
spacing: 20 # pixels between panels
label_position: bottom # top or bottom
output: "composite.png"
items:
- input: method_encoder.txt
caption: "Encoder architecture"
id: panel_a
# ...
The composite image is saved alongside the individual panels in the batch output directory. See examples/composite_batch_manifest.yaml for a complete example.
Generate a human-readable report from an existing batch run (Markdown or HTML):
paperbanana batch-report --batch-dir outputs/batch_20250109_123456_abc --format markdown
or by batch ID (under default output dir)
paperbanana batch-report --batch-id batch_20250109_123456_abc --format html --output report.html
Diagram batch reports include batch_kind: methodology; plot batches use batch_kind: statistical_plot. Human-readable reports (paperbanana batch-report) show the batch kind when present.
Sweep manifests let you store the full sweep plan as YAML/JSON instead of eight comma-separated CLI flags. Mutually exclusive with the axis flags; see examples/sweep_manifest.yaml.
paperbanana sweep --manifest examples/sweep_manifest.yaml
Sweep reports produced by paperbanana sweep can be rendered the same way:
paperbanana sweep-report --sweep-dir outputs/sweep_20250109_123456_abc --format html
or by sweep ID
paperbanana sweep-report --sweep-id sweep_20250109_123456_abc --format markdown
Rendered sweep reports include a summary, a top-5 ranked table, the full variants table (with per-variant provider/model, iterations, critic-suggestion count, proxy score, and output path), and the quality_proxy_score note. Dry-run reports render a simplified "Planned Variants" section.
| Flag | Short | Description |
|------|-------|-------------|
| --manifest | -m | Path to manifest file (required) |
| --output-dir | -o | Parent directory for batch run (default: outputs) |
| --config | | Path to config YAML |
| --iterations | -n | Refinement iterations per item |
| --optimize | | Preprocess inputs for each item |
| --auto | | Loop until critic satisfied per item |
| --format | -f | Output image format (png, jpeg, webp) |
| --auto-download-data | | Auto-download the PaperBananaBench reference set (~254 MB) if not cached |
paperbanana plot-batch -- Batch Statistical PlotsGenerate multiple plots from a manifest (YAML or JSON). Each item specifies a data file (CSV or JSON) and an intent string, mirroring paperbanana plot. Outputs live under outputs/batch_/run_/ with the same batch_report.json and paperbanana batch-report workflow as diagram batches.
paperbanana plot-batch --manifest examples/plot_batch_manifest.yaml --optimize
Manifest format (items list):
items:
- data: path/to/results.csv
intent: "Bar chart comparing accuracy across models"
id: fig_acc
- data: other.json
intent: "Scatter plot with trend line"
aspect_ratio: "16:9" # optional per item; CLI --aspect-ratio is the default when omitted
Paths are resolved relative to the manifest file’s directory.
| Flag | Short | Description |
|------|-------|-------------|
| --manifest | -m | Path to manifest (required) |
| --output-dir | -o | Parent directory for batch_* (default: outputs) |
| --config | | Path to config YAML |
| --vlm-provider | | VLM provider (default: gemini) |
| --vlm-model | | VLM model override |
| --image-provider | | Image gen provider |
| --image-model | | Image gen model |
| --iterations | -n | Refinement iterations per item |
| --auto | | Loop until critic satisfied per item |
| --max-iterations | | Safety cap for --auto |
| --optimize | | Input optimization per item |
| --format | -f | png, jpeg, or webp |
| --save-prompts / --no-save-prompts | | Persist prompts (default: on, same as plot) |
| --venue | | Venue style pack: built-in (neurips, icml, acl, ieee), a user pack, or custom |
| --aspect-ratio | -ar | Default aspect ratio when not set in the manifest |
| --verbose | -v | Verbose logging |
paperbanana orchestrate -- Full-Paper Figure PackageGenerate a publication-focused figure bundle from a full paper source, with optional data-driven plots. The command:
.txt, .md, or .pdf)figure_package.json, figures/, figures.tex, and captions.mdpaperbanana orchestrate \
--paper paper.pdf \
--data-dir ./results \
--max-method-figures 4 \
--max-plot-figures 3 \
--optimize
Use --dry-run to only plan and inspect orchestration_plan.json without API calls.
Use --resume-orchestrate to continue an interrupted orchestration from checkpoint state.
| Flag | Description |
|------|-------------|
| --paper / -p | Paper source path (.txt, .md, or .pdf) |
| --resume-orchestrate | Resume an existing orchestration by ID or directory |
| --retry-failed | When resuming, include previously failed tasks |
| --max-retries | Extra retries per task after first failure |
| --data-dir | Optional directory containing CSV/JSON files for plot planning |
| --output-dir / -o | Parent output directory (creates orchestrate_*) |
| --max-method-figures | Max methodology figures to plan/generate |
| --max-plot-figures | Max plot figures to plan/generate |
| --pdf-pages | PDF-only page selection (e.g. 1-5, 2,4,6-8) |
| --optimize | Enable input optimization for generated items |
| --iterations / -n | Refinement iterations per generated item |
| --auto + --max-iterations | Critic-driven auto-refine mode with safety cap |
| --concurrency | Parallel figure generation workers |
| --format / -f | Output format (png, jpeg, webp) |
| `--dry-ru
→→ →
→ →
→ →
→ →
→ →
→ →
→